Operational Health
Distinguish measured green, yellow and red health from unmeasured items.
Operational HealthDistinguish measured green, yellow and red health from unmeasured items.
Dependency ContextInspect recorded infrastructure and service relationships.
Related IncidentsOpen operational tickets from the affected configuration item.
Event OperationsConnect alert ownership and investigation with incident workflows.
SignalContext
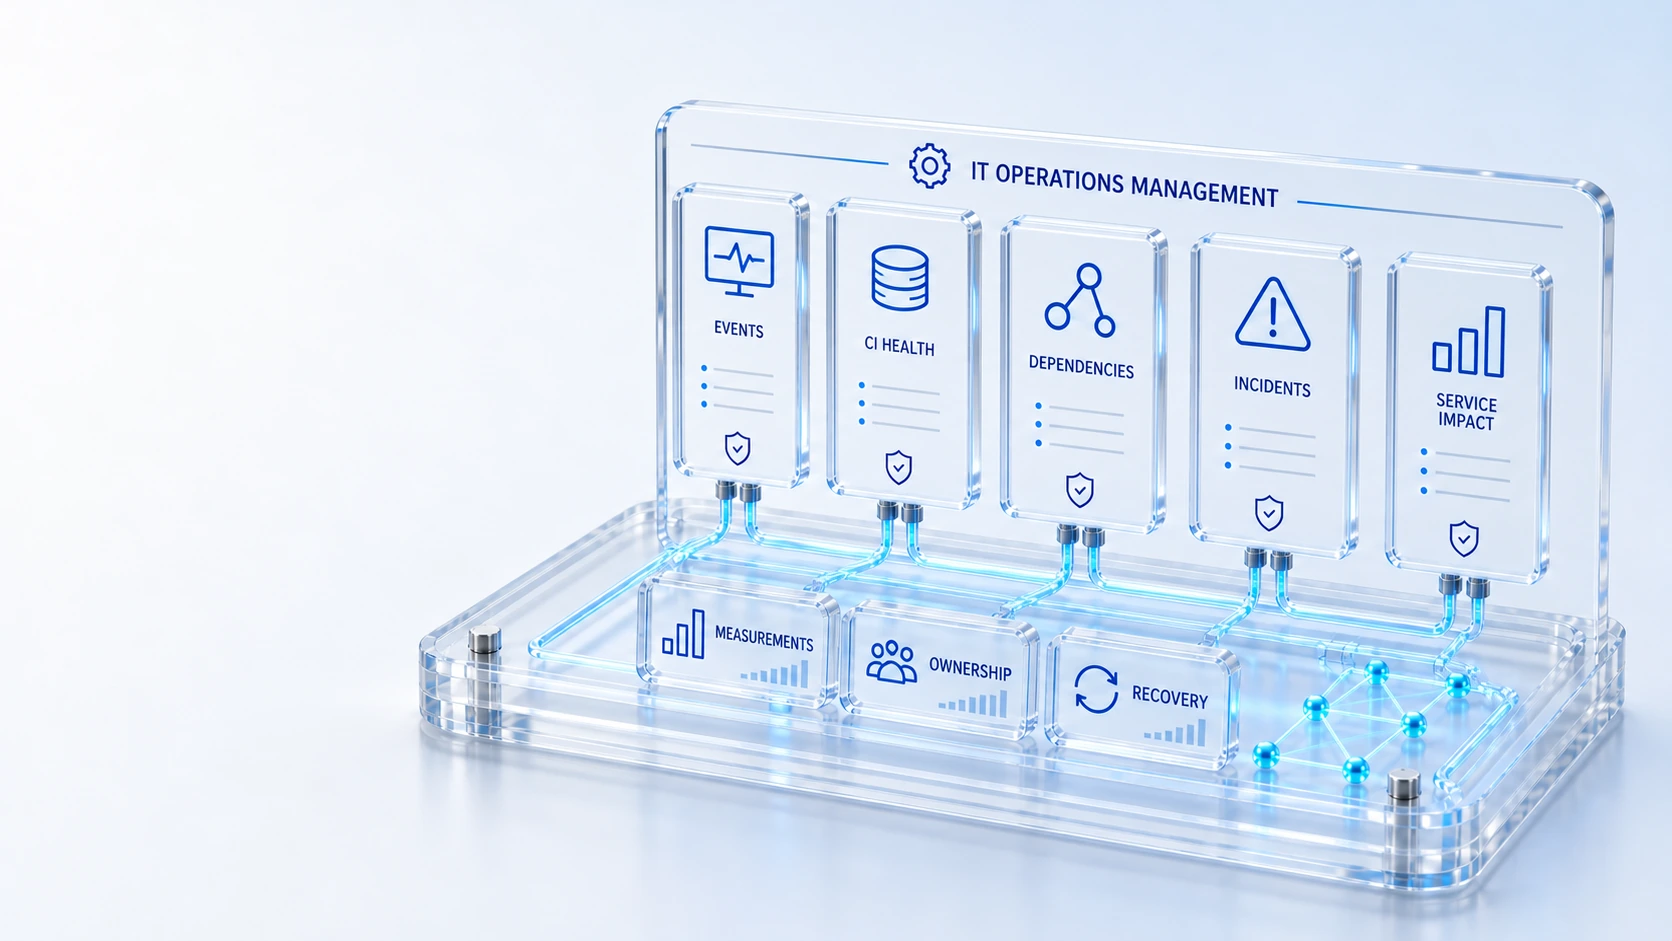
Bring events, CI health, saved dependencies and incident response together so responders can investigate with context.
Distinguish measured green, yellow and red health from unmeasured items.
Inspect recorded infrastructure and service relationships.
Open operational tickets from the affected configuration item.
Connect alert ownership and investigation with incident workflows.
Signal → Context → Recovery
Explore the details below, then bring your workflow, source data and questions to a guided conversation.
Built into the platform
Distinguish measured green, yellow and red health from unmeasured items.
Inspect recorded infrastructure and service relationships.
Open operational tickets from the affected configuration item.
Connect alert ownership and investigation with incident workflows.
Follow recorded service and offering dependencies.
Review source records and export the loaded reporting scope.
Actual product view
See the running demo environment. Features and records are subject to your role, configuration and integrations.
Connected by design
Service records, configuration items, people, locations and evidence share the same operational foundation. Move from investigation to the related asset, service or customer workflow with clear ownership.
Explore the platform architectureImplementation context
Views and actions follow configured roles, permissions, enabled modules and connected source data. Screens show a demonstration environment.
Who this is for
A red infrastructure signal does not explain the affected business service. Investigators need recorded dependencies, meaningful health coverage and related incidents before deciding where to focus attention. An evaluation of IT Operations Management should make those boundaries inspectable before the team relies on the operating view.
Illustrative walkthrough
A fictional operations team sees degraded database health during an online ordering slowdown. It wants to inspect saved relationships, identify the related service and route technical investigation into an accountable incident. This is an illustrative evaluation scenario, not a claim about a customer deployment.
Separate CIs with recorded red or yellow health from items that have no current measurement at all. Distinguish measured green, yellow and red health from unmeasured items.
Inspect the saved relationships around the database and service before treating a nearby CI as the cause of the incident. Open operational tickets from the affected configuration item.
Open related operational tickets from the configuration context and preserve the source observations used to choose the next investigation step. Follow recorded service and offering dependencies.
Ask the demonstrator to show the relationship record behind a visible dependency and the measurement behind a health status, including a deliberately unmeasured item. Use demonstration records and preserve the applicable reporting scope.
Explore the platform
Open a workspace for a closer look.
Prepare the evaluation
These are evaluation criteria, not promised outcomes. Agree the baseline, scope, source coverage and acceptance method with the responsible owners before drawing conclusions.
Questions for this topic
A saved relationship supplies investigation context, not proof of causation; responders still need observations and technical validation before selecting a remedy.
Unmeasured configuration items remain distinguishable from measured healthy items so absence of evidence is not presented as a green operational result.
The workspace supports reviewing source records and exporting the loaded reporting scope, subject to the permissions and data available to the current role.
Your next operating chapter
Bring one workflow, one service challenge or one part of your estate. We’ll show you where Qintorava fits.