Event Workspace
Review operational events in a focused surface.
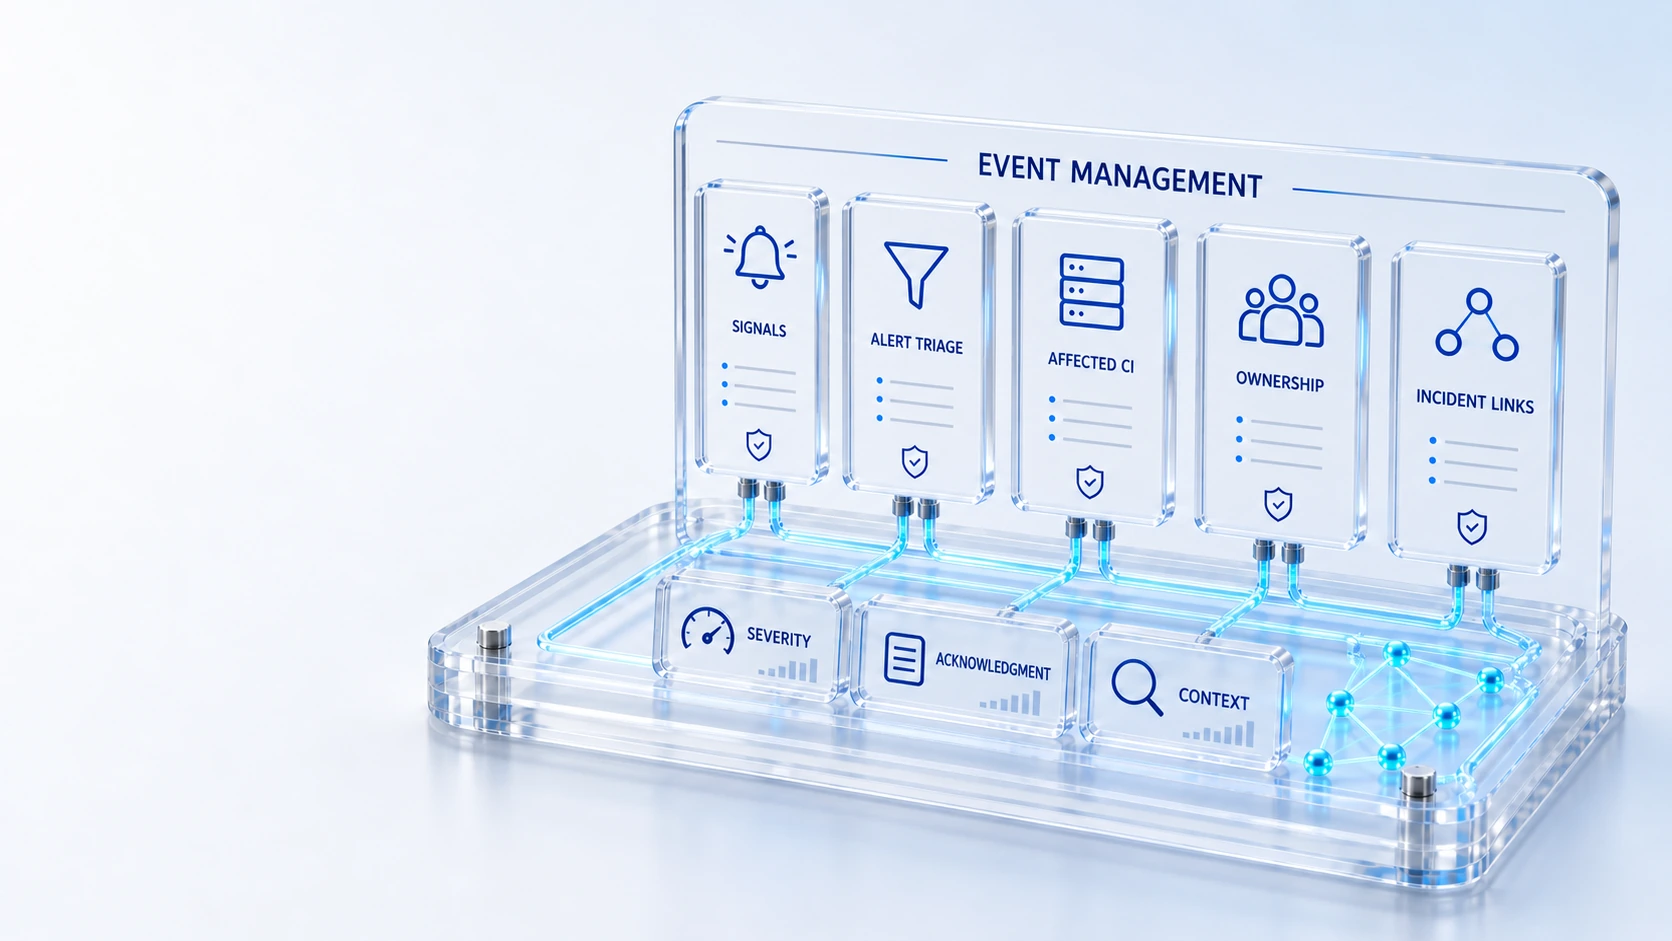
Event WorkspaceReview operational events in a focused surface.
Alert TriageTrack severity, acknowledgment and ownership.
CI AssociationConnect signals to known configuration items.
Incident LinkageMove investigations into the technical recovery workflow.
SignalTriage
Investigate events and alerts with affected CIs, ownership and linked incident evidence.
Review operational events in a focused surface.
Track severity, acknowledgment and ownership.
Connect signals to known configuration items.
Move investigations into the technical recovery workflow.
Signal → Triage → Incident
Explore the details below, then bring your workflow, source data and questions to a guided conversation.
Built into the platform
Review operational events in a focused surface.
Track severity, acknowledgment and ownership.
Connect signals to known configuration items.
Move investigations into the technical recovery workflow.
Distinguish suppressed from active alerts.
Review recorded signal and response history.
Actual product view
See the running demo environment. Features and records are subject to your role, configuration and integrations.
Connected by design
Service records, configuration items, people, locations and evidence share the same operational foundation. Move from investigation to the related asset, service or customer workflow with clear ownership.
Explore the platform architectureImplementation context
Views and actions follow configured roles, permissions, enabled modules and connected source data. Screens show a demonstration environment.
Who this is for
A busy event stream does not become actionable until severity, ownership and the affected configuration item are clear. Operators also need to distinguish active alerts from suppressed ones and connect investigation to a technical recovery record.
Illustrative walkthrough
A fictional NOC receives alerts associated with a service dependency. The analyst reviews severity and acknowledgment, checks whether related signals are suppressed and links the investigation to the appropriate incident owner. This is an illustrative evaluation scenario, not a claim about a customer deployment.
Review event and alert state, severity and acknowledgment, then identify the operator or team accountable for the next investigation step. Review operational events in a focused surface.
Confirm the affected configuration item and review suppressed versus active alerts before deciding which observations should influence the current operational response. Connect signals to known configuration items.
Associate the investigation with its technical incident and preserve the signal and response history needed by the recovery team and later reviewers. Distinguish suppressed from active alerts.
Show an active and a suppressed alert, their affected CI context and the linked technical incident so the evaluator can follow why a particular signal received operational attention. Use demonstration records and preserve the applicable reporting scope.
Explore the platform
Open a workspace for a closer look.
Prepare the evaluation
These are evaluation criteria, not promised outcomes. Agree the baseline, scope, source coverage and acceptance method with the responsible owners before drawing conclusions.
Questions for this topic
No. Suppression is an alert control state and should remain distinguishable from technical recovery or resolution of an incident linked to that signal.
The verified scope covers recorded events, alert triage, CI associations, suppression and incident links; any additional correlation behavior should be demonstrated and qualified for the proposed integration.
The workspace exposes recorded signal and response history, allowing a reviewer to inspect the operational evidence associated with the alert and linked recovery work.
Your next operating chapter
Bring one workflow, one service challenge or one part of your estate. We’ll show you where Qintorava fits.