Start with Your Baseline
Enter your operating volumes, costs and assumptions.
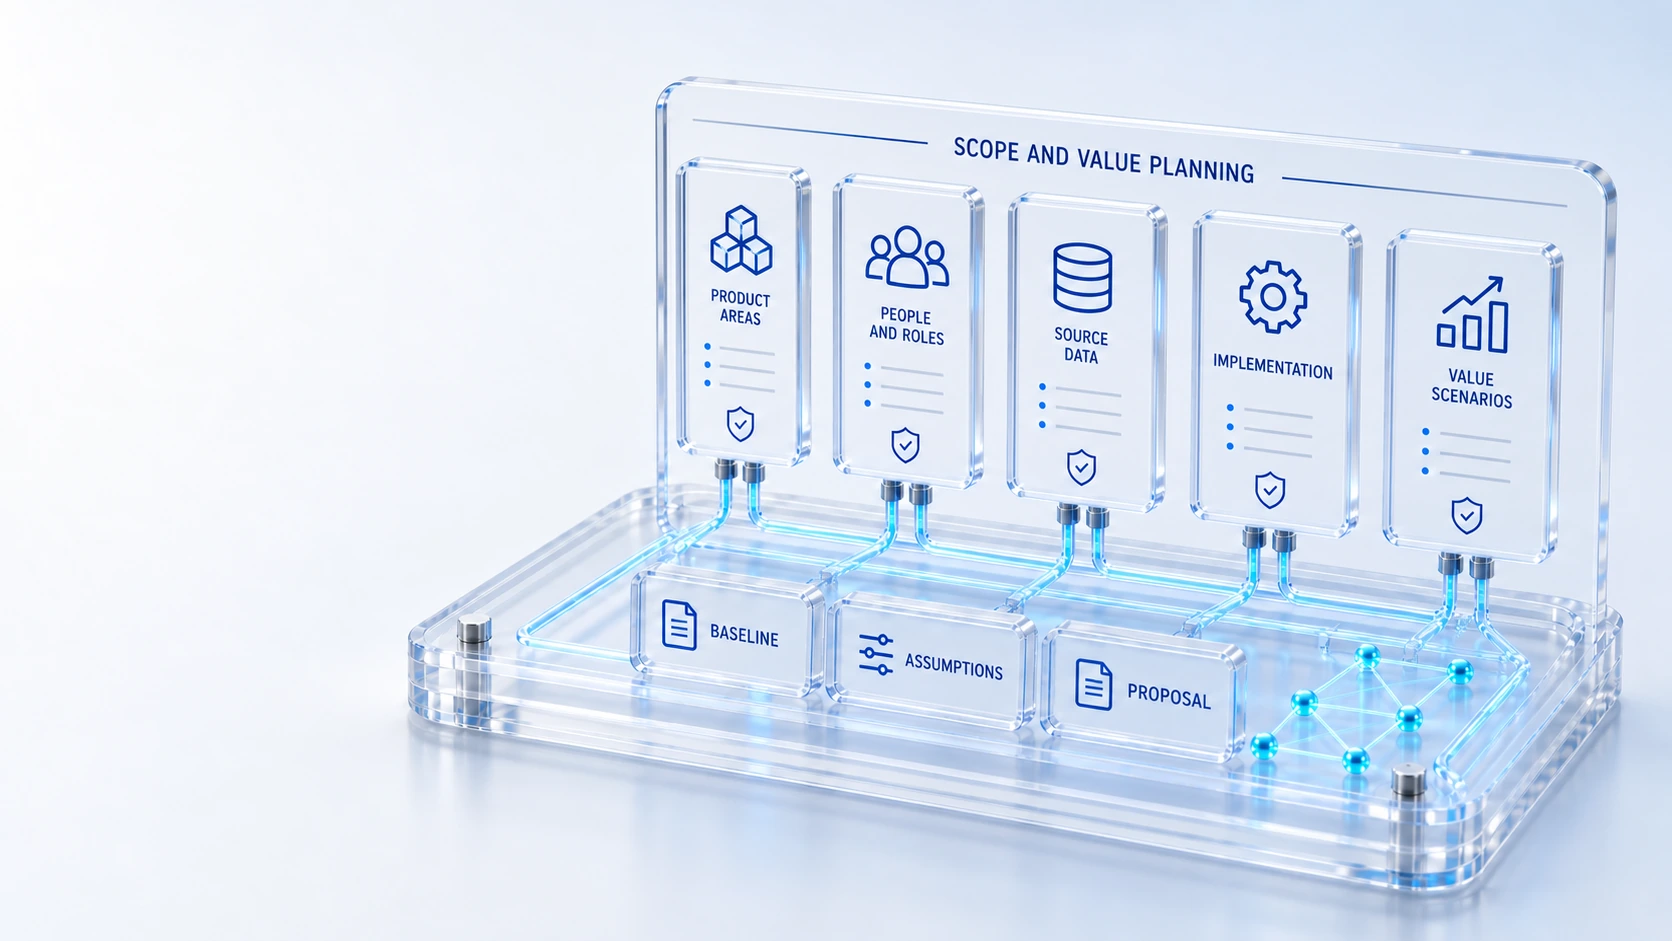
Start with Your BaselineEnter your operating volumes, costs and assumptions.
Explore a ScenarioInspect the calculator output and its savings breakdown.
Review the AssumptionsTreat results as estimates, rather than measured outcomes.
Discuss a Value CaseValidate your scope, baseline and proposal with Qintorava.
BaselineAssumptions
Build an illustrative scenario using your own operating data. Outputs are estimates, not verified product savings, a price quote or a performance commitment.
Enter your operating volumes, costs and assumptions.
Inspect the calculator output and its savings breakdown.
Treat results as estimates, rather than measured outcomes.
Validate your scope, baseline and proposal with Qintorava.
Baseline → Assumptions → Proposal
Illustrative scenarios use your inputs. Results are estimates, not measured product outcomes.
Customize your results
Run the calculator to generate a detailed ROI model and downloadable presentation.
Cloud optimization, tool consolidation, ticket deflection, engineering capacity, and incident avoidance will appear here.
Value drivers
AI-assisted triage, ticket deflection, runbook execution, service-owner routing, and workflow automation.
Faster request fulfillment, better self-service, cleaner knowledge, and reduced queue friction.
Reusable workflows, graph context, governed agent patterns, and faster rollout of new automation paths.
Cloud optimization, redundant tool consolidation, FinOps action, and executive accountability.
Lower major incident impact, policy-gated remediation, rollback-ready action, and evidence capture.
Board-ready view of savings, automation value, risk posture, service health, and implementation milestones.
Download your report
Enter cloud spend, tooling spend, ticket volume, incident exposure, and Qintorava cost assumptions.
Methodology
Rightsizing, scheduling, policy remediation, commitment optimization, and idle resource removal.
Reduction of overlapping service, operations, CMDB, integration, and reporting spend.
Ticket deflection and AI-assisted triage reduce manual handling time and escalation waste.
Faster correlation, graph context, and governed remediation reduce major incident cost exposure.
Validate the model
Qintorava can help validate current-state baselines, first-wave workflows, governance requirements, deployment scope, and executive reporting milestones.
Who this is for
An ROI scenario is only as credible as its assumptions. The calculator separates modeled cash benefits, staff capacity and incident exposure, while allowing implementation and recurring costs to be considered. It is a planning tool that should support a review, not replace one.
Illustrative walkthrough
Enter aggregate operating volumes and costs, then review the assumptions with Finance and the responsible service owners. Compare a lower-benefit case and confirm that the proposed investment and rollout assumptions match the commercial scope under discussion.
Review costs, ticket volumes, handling time, benefit rates and realization timing. Use advanced assumptions to reflect the proposal and your operating model. Identify which inputs come from observed data and which remain estimates to validate during an evaluation.
Examine three-year cash results, investment, NPV and modeled payback alongside capacity and incident-risk assumptions. Do not treat recovered time as cash without an explicit basis. A negative result or payback outside the horizon should remain visible in the decision.
Download the executive presentation or request delivery to an authorized email address. The server recalculates the scenario for the report. Review the attachment, source qualifications, sensitivities and implementation risks before presenting it as a leadership business case.
For this illustrative evaluation, retain the starting records, the decisions made by each accountable role, and the evidence that supports completion. Agree the scope and acceptance criteria before interpreting a demonstration as production readiness.
Explore the platform
Open a workspace for a closer look.
Prepare the evaluation
These are evaluation criteria, not promised outcomes. Agree the baseline, scope, source coverage and acceptance method with the responsible owners before drawing conclusions.
Questions for this topic
The on-page calculation runs in the browser. Downloading or emailing a presentation sends the scenario to the report service so the executive report can be generated. The Privacy Policy describes that processing and requested delivery.
No. The presentation is an illustrative business case based on your inputs and assumptions. It does not establish commercial terms or measured results. Validate scope, costs, benefits and implementation responsibilities before an investment decision.
The recipient popup asks for an authorized address. The service generates the executive presentation and sends a summary with the attachment from no-reply@qintorava.io. Provider acceptance is not a guarantee of inbox placement; you can also download the report.